Quick start
Shakudo Platform enables you to develop in a pre-config environments and deploy without docker built. The development environment are accessible through Jupyter notebooks, Code-server and local IDE like VSCode.
In this tutorial we'll walk you through a basic example of going from development to deployment of a simple data processing pipeline.
1. Start a Session
Sessions are pre-configured virtual machines (VMs) with connections to all the tools and resources necessary for development. To begin development, navigate to the Sessions tab on the dashboard and click the +Start a Session button. You will see a dialog window to start a session like the image below.
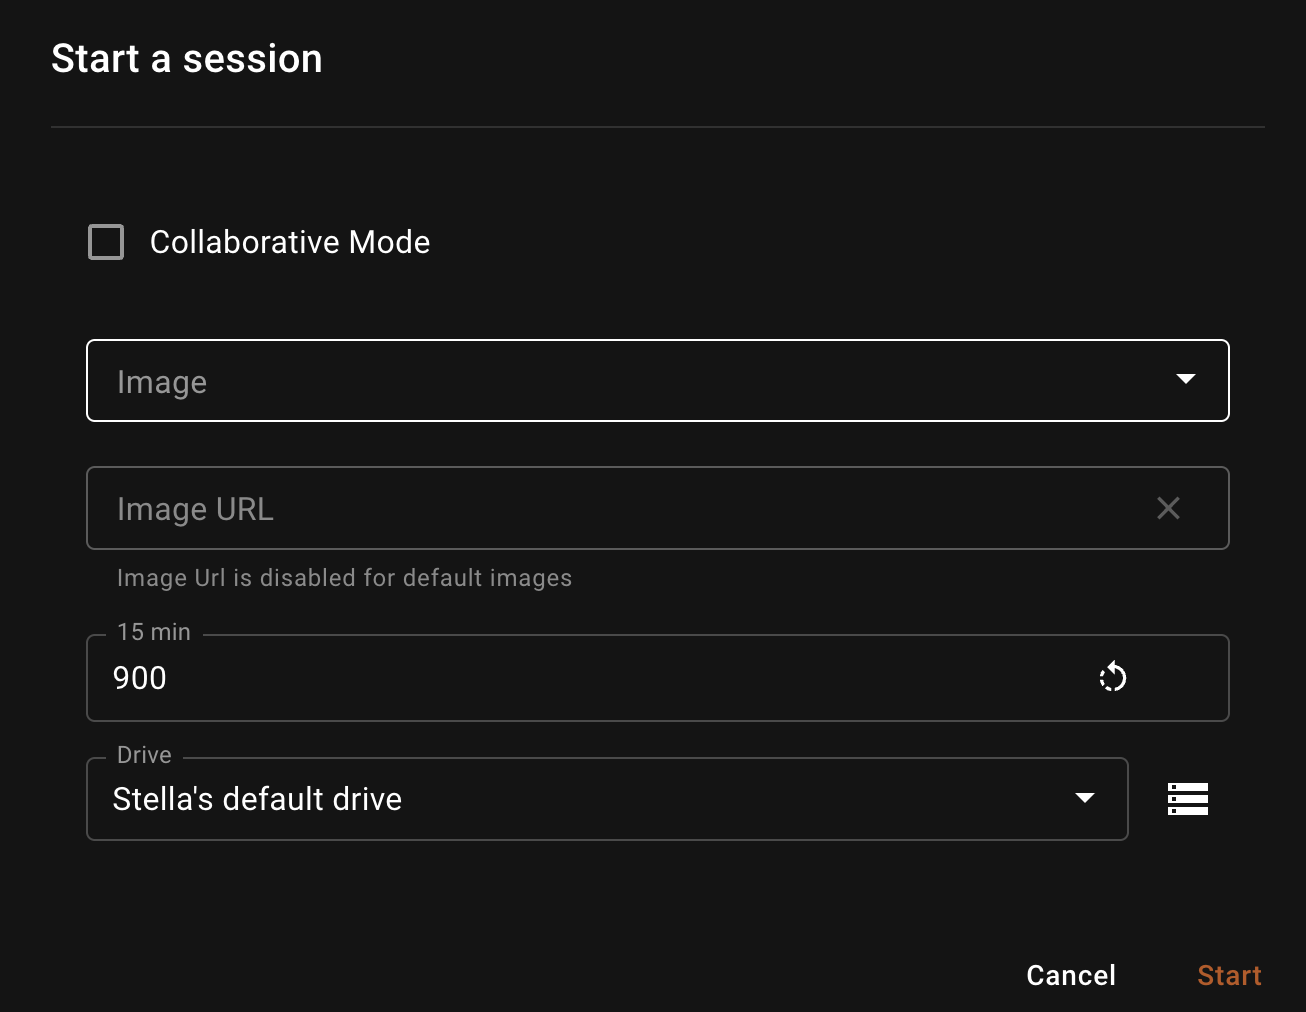
Image: Choose the image type to use in the session. To add new image to the dropdown permanently, you can add a new
Environment Configunder theadmin settings. Please checkout EC for more details. In this example, we are going to use theBasicimage in the dropdown. For more information on Session Types and other configurations check out the Guide on SessionsImageURL: You can paste any image URL in the Image Url field. This will overwrite the
Imageabove field that we have chosen and use the ImageURL instead. This is useful for quick testing, we need to make sure the image registry credentials are added to the shakudo environment. This is usually setup at installation time. If you'd like to add more image registry access, please contact your Kubernets cluster admin or Shakudo support.Timeout: Choose the idle timeout for the session. Idle timeout is defined as the number of seconds from which the session has been continuously idling. It's default to 15 minutes.
Drive: Drive is the persistent volume that this session will use. Persistent volumes is a Kubernetes term, imaging it as a hard drive in a laptop. You can have multiple drives and manage your drives by clicking on the icon to the right of the
Drivefield.
2. Access the Session
Once the Session is ready, you'll see a Jupyterlab icon and a SSH icon. If your image has CodeServer, you will also see a VsCode icon. To see the different ways of accessing the session, checkout the Guide on Sessions. In this example, we'll use the Jupyterlab option.
3. Process with Pandas
The dataset we are using is the flight dataset in a public AWS S3 bucket. The dataset has 22 CSV files and has a total size of 11 GB. The objective is to identify the airport with the most frequently delayed arriving flights. This can be achieved through a few simple Pandas DataFrame transformations. Your session should already be set up to connect to your internal data source if this is a local storage bucket.
Let's first use the groupby and nlargest function in Pandas to benchmark.
## loop through 22 files and groupby one by one, on the 16vCPU 16 GB RAM node that the session is on

from tqdm.notebook import tqdm
results = []
for file in tqdm(files):
    df = pd.read_csv(
        f"s3://{file}",
        encoding = "ISO-8859-1",
        usecols = ['DepTime','FlightNum','DepDelay','Origin', 'Dest','Distance']
                    )
    df['isDelayed'] = df.DepDelay.fillna(16) > 15
    df_delayed = df.groupby(['Origin','Dest']).isDelayed.mean()
    results.append(df_delayed)

df_results = pd.concat(results).reset_index()
df_results = df_results.groupby(['Origin','Dest']).mean()
df_results = df_results[df_results.isDelayed==1].reset_index()
print(f'found {len(df_results)} most delayed flights Origin and destination pairs')
The processing time of the above operation is 6 minutes and 26 seconds on a 16 vCPU 16GB RAM machine. There are many ways to speed things up, here we use distributed Dask.
4. Spin up a Dask cluster
Dask is a powerful distributed computing framework and can scale from multi-core local machine to large distributed clusters. Dask provides a familiar user interface by mirroring the APIs of other libraries in the PyData ecosystem including: Pandas, Scikit-learn and NumPy, leading to a shallow learning curve.
We can use the Shakudo package notebook_common to spin up a fully configured Dask cluster with preemptible nodes. You can specify the number of workers with argument num_workers or specify more specs to better fit the computation. Shakudo will automatically choose a cluster configuration for you and provides a Dask dashboard link to monitor progress.
from hyperplane import notebook_common as nc
num_workers = 2   ## number of worker nodes
total_memory = 12   ## total memory size for the worker nodes in GB
cors_per_worker = 15  ## total number of cores for the worker nodes
nprocs = 3  ## number of processes for each worker node
ram_gb_per_proc = total_memory/nprocs  ## calculated memory size per processes in GB
nthreads = int(cors_per_worker/nprocs) ## calculated number of threads per processes

client, cluster = nc.initialize_cluster(
        num_workers = num_workers,
        nprocs = nprocs,
        nthreads = nthreads,
        ram_gb_per_proc = ram_gb_per_proc,
        cores_per_worker = cors_per_worker,
        node_selector = {}
    )
You will be able to see the spinning up logs of the Dask cluster and the link to the Dask dashboard.
👉 Shakudo Platform: selecting worker node pool
👉 Shakudo Platform: selecting scheduler node pool
Creating scheduler pod on cluster. This may take some time.
👉 Shakudo Platform: spinning up a dask cluster with a scheduler as a standalone container.
👉 Shakudo Platform: In a few minutes you'll be able to access the dashboard at https://ds.hyperplane.dev/dask-cluster-e002f3d0-b18d-4027-81c5-bed613eb63a4/status
👉 Shakudo Platform: to get logs from all workers, do `cluster.get_logs()`
By clicking on the link above you'll see the unique distributed Dask dashboard.
5. Process data in Dask
To run the code from step 3 on a Dask cluster, we just need to swap the Pandas API to the Dask API. Dask does lazy computation, the last line .compute() function triggers the actual computation. You can find information on the Dask concepts and Dask best practices page. Check out the Dask official documentation for more.
import dask.dataframe as dd
df = dd.read_csv([f"s3://{file}" for file in files],
                 encoding = "ISO-8859-1",
                 usecols = ['DepTime','FlightNum','DepDelay','Origin', 'Dest','Distance'],
                 dtype={'Distance': 'float64'}
                )
df['isDelayed'] = df.DepDelay.fillna(16) > 15
df_delayed = df.groupby(['Origin','Dest']).isDelayed.mean()
df_results = df_delayed[df_delayed==1].compute().reset_index()
print(f'found {len(df_results)} most delayed flights Origin and destination pairs')
The Dask operation took 20 seconds using 2 remote 16 vCPU 16GB RAM Dask nodes. Comparing to Pandas, that's a ~20x speed up with only 2 extra nodes!
After using Dask it's good practice to close the cluster after the computation. Add the line below at the end of your notebook:
client.shutdown()
6. Creating the YAML file for deployment
Now the data processing notebook is developed and tested, to automatically run this notebook on a schedule as in most production setups, we can simply add a pipeline.yaml file to build a pipeline. To read more on pipeline YAML files please visit the create a pipeline job page.
Open a text file on your browser Session by clicking on the blue + button on the top left of the side bar.
Copy and paste the content below:
pipeline:
  name: "data prep pipeline"
  tasks:
  - name: "dask processing data"
    type: "jupyter notebook"
    notebook_path: "example_notebooks/doc_demo/quick_start/dask.ipynb"  # path to the script to run
    notebook_output_path: "dask_output.ipynb"
In this YAML file, we'll need to change the notebook_path to the actual path in your repository.
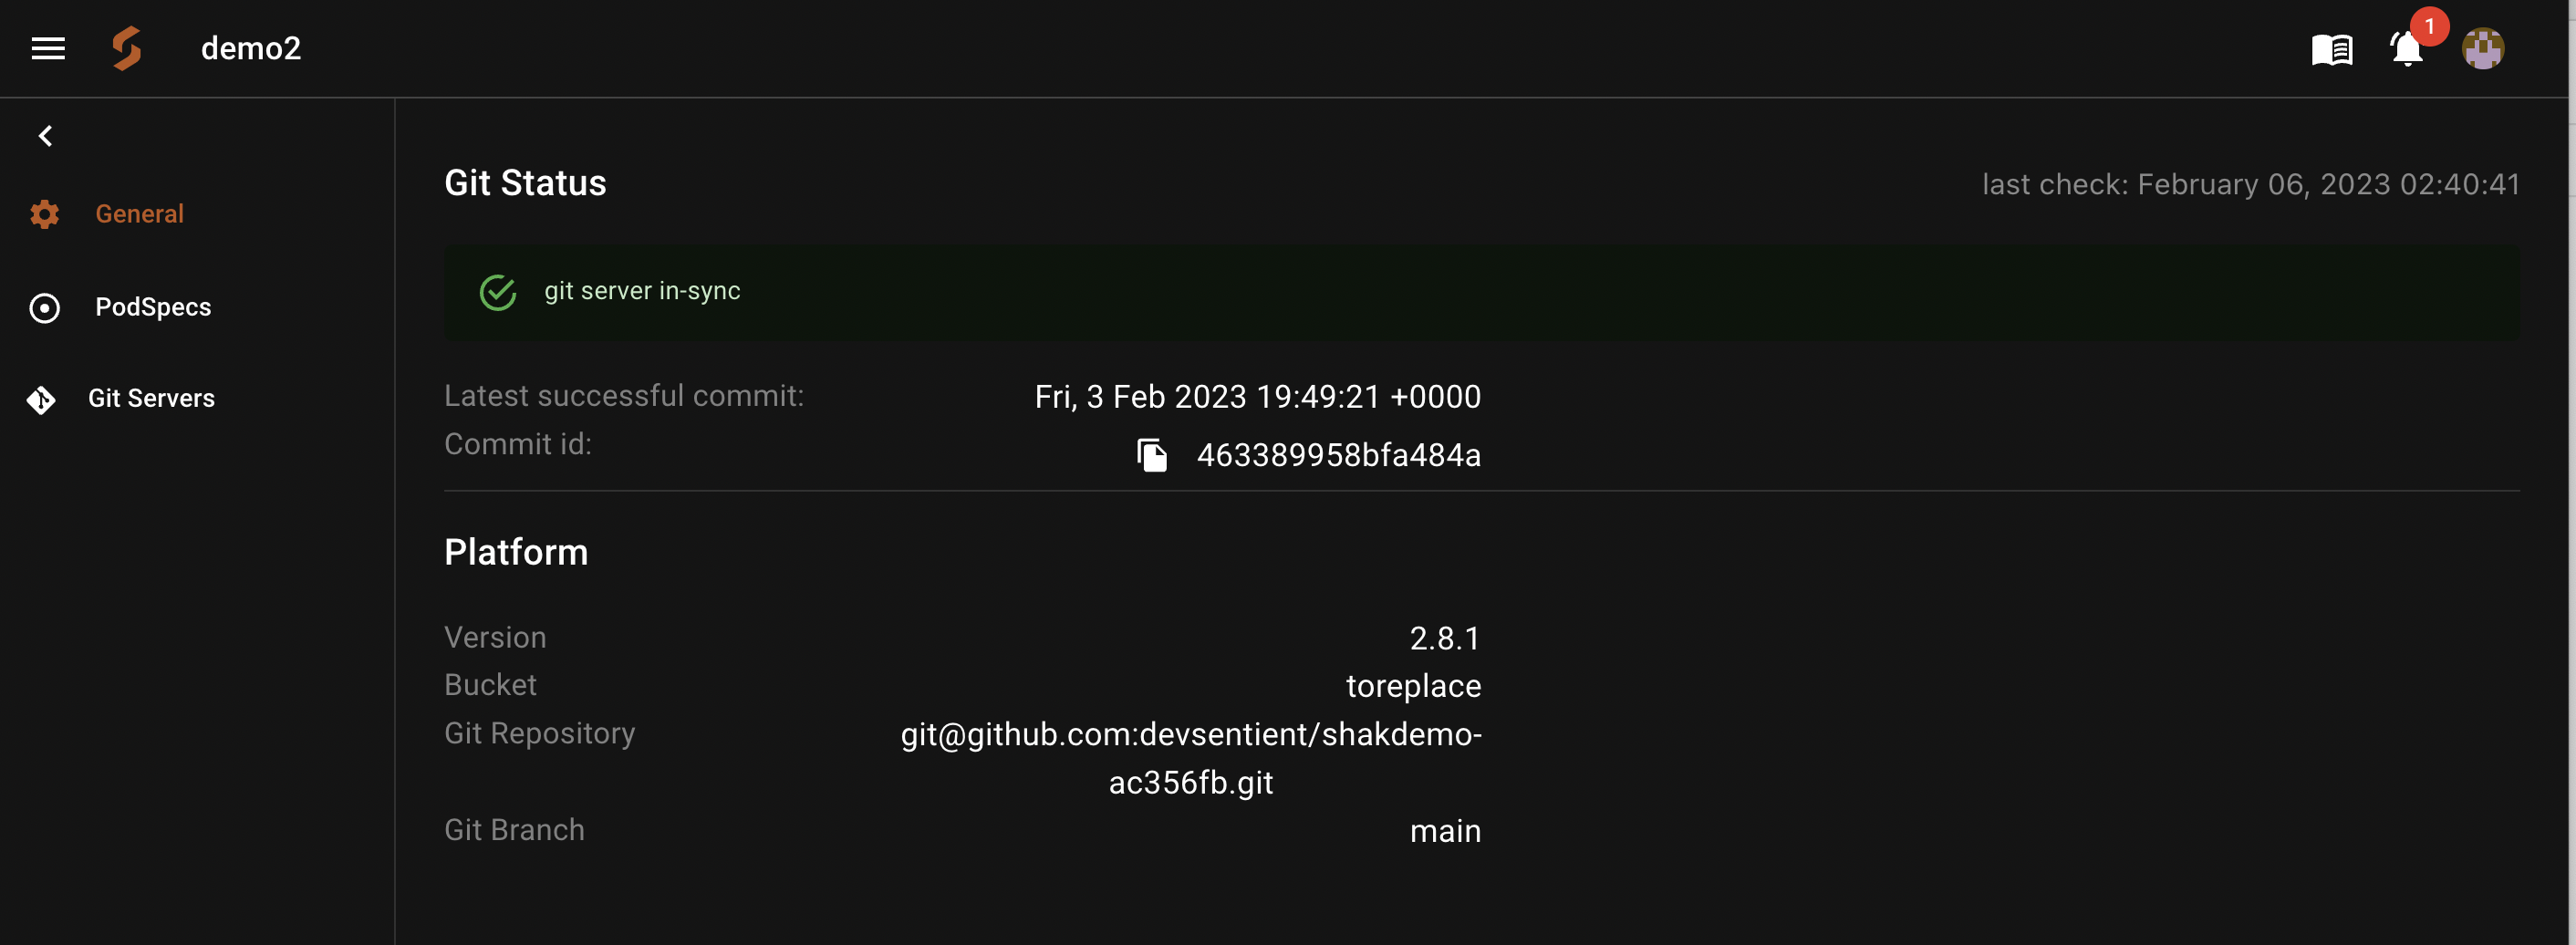
This YAML is all we need to deploy the pipeline. Now let's commit the notebook and the YAML file to a GIT repository and run the job. Shakudo maintains live syncs of the repositories that are connect and make the code available for deployment immediately after code is synced. You can check the status of the git sync at Admin Settings.
7. Deploy to a pipeline job
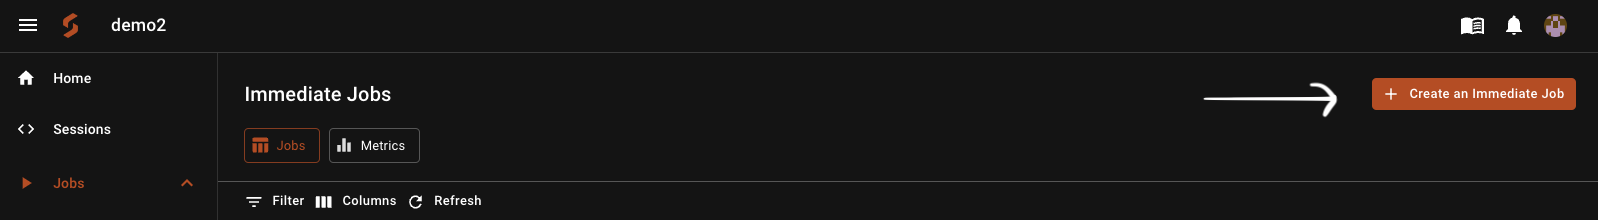
Now we are one step away to put the job in production! To launch a pipeline job, we can go to the Shakudo Platform dashboard's Jobs tab and click Create.
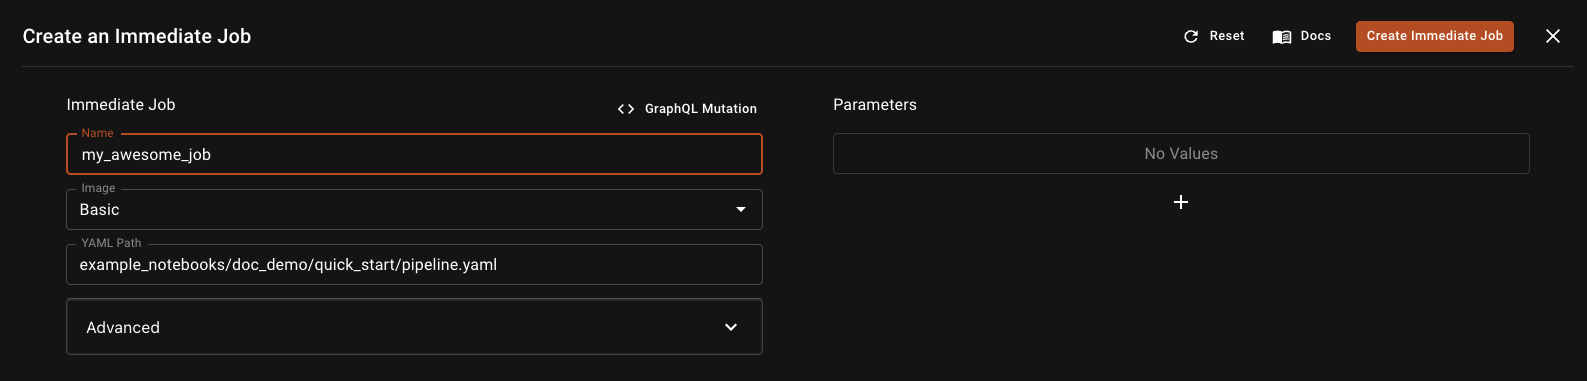
In the job dialogue, we need to fill the following:
- Name: Job name or use the randomized name
- Image: Choose the image that we developed the code on to maintain environment consistency
- YAML path: Paste the path of the YAML file that we created above, from the root of the repository
Click the Create Immediate Job button on the top right corner to create the job.
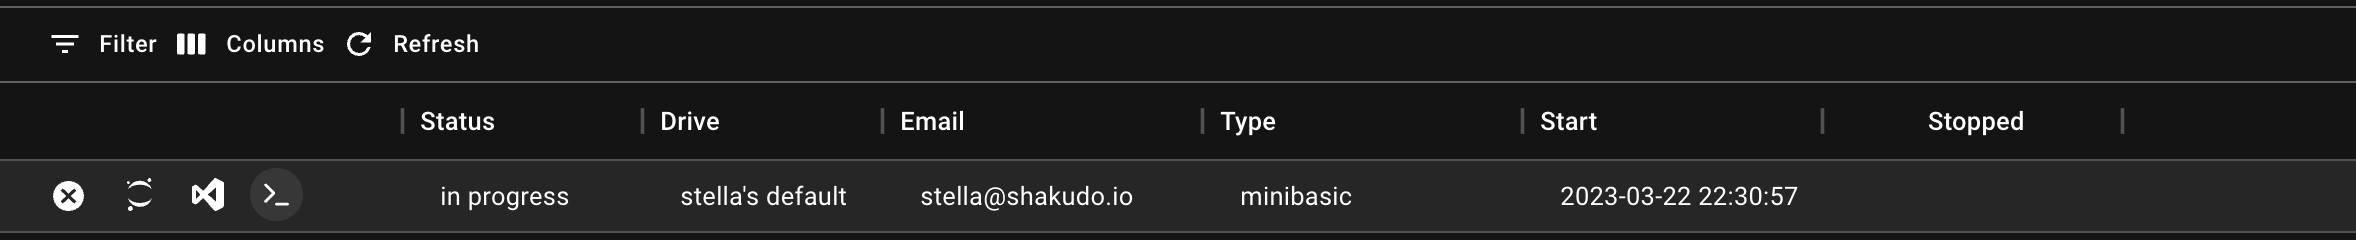
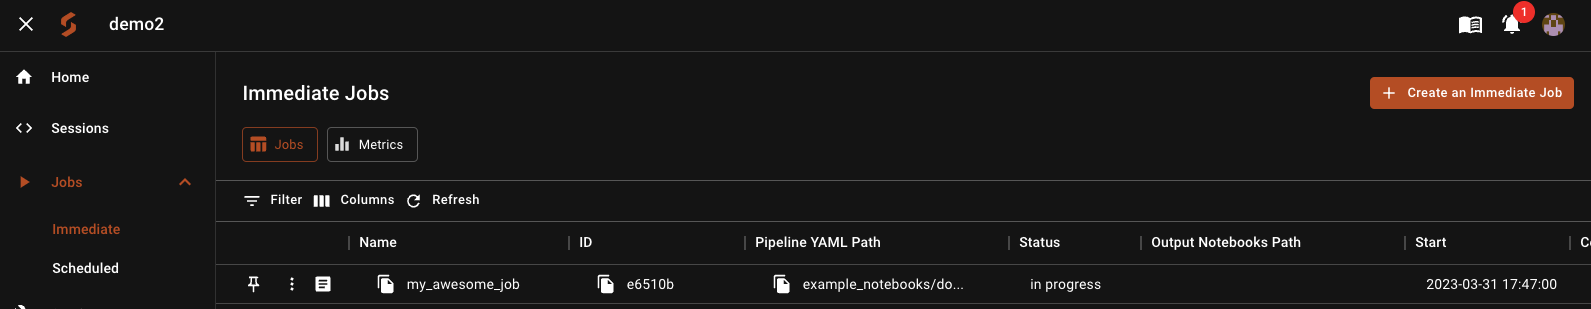
8. Check job status
Once the job is submitted, you are redirected to the immediate jobs dashboard where our job is at the top of the job list. To see the live log of the job, click on the file button. You can pin the job to the top with the pin button, or checkout more functions in side the three dots.
Congratulations on developed and deployed your first Shakudo job pipeline with distributed computing!
9. Additional Steps
Shakudo Platform offers a variety of other functionalities for more advanced workflows. Some additional uses include the following: